Thermal imaging electrical inspection: practical guide
A thermal imaging electrical inspection detects abnormal heat signatures in live electrical equipment so you can locate developing faults without shutting systems down. It is a non-contact, non-destructive diagnostic method that converts infrared radiation into false-colour images, revealing temperature anomalies that indicate loose connections, overloaded conductors, phase imbalances, and failing components before they cause a failure or fire.
When to book a thermal inspection:
- Critical assets (main switchboards, transformers, motor control centres, UPS systems) on an annual cycle at minimum
- Before insurance renewals or audits requiring certified thermography reports
- After unexplained circuit trips, nuisance faults, or visible signs of heat damage
- As part of a pre-purchase electrical inspection or acquisition due diligence
- For solar PV systems, under the specific irradiance and classification requirements of IEC 62446-3
Immediate benefits: zero downtime during scanning, early fault detection before failure, documented evidence for insurers and WHS compliance, and a clear remedial priority list.
Next step: engage a thermographer certified to AS ISO 18436.7 or your licensed Level 2 electrician with thermography capability. NETA guidance provides widely referenced ΔT criteria for prioritising findings, and IEC 62446-3 governs PV-specific thermal surveys.
Table of Contents
- How does thermal imaging work in electrical maintenance?
- Which electrical components are typically scanned?
- What fault signatures should you look for in a thermogram?
- When should you scan, and what load is required?
- How do you keep live inspections safe?
- Why do emissivity and reflective surfaces affect your readings?
- What camera specifications should you require from a thermographer?
- What do you do after finding a hot or cold spot?
- How often should you inspect, and what thresholds trigger action?
- Key takeaways
- What thermal imaging looks like from the contractor's side
- High Demand Electrical: certified electrical inspections and repairs across Sydney
- Useful standards and resources
How does thermal imaging work in electrical maintenance?
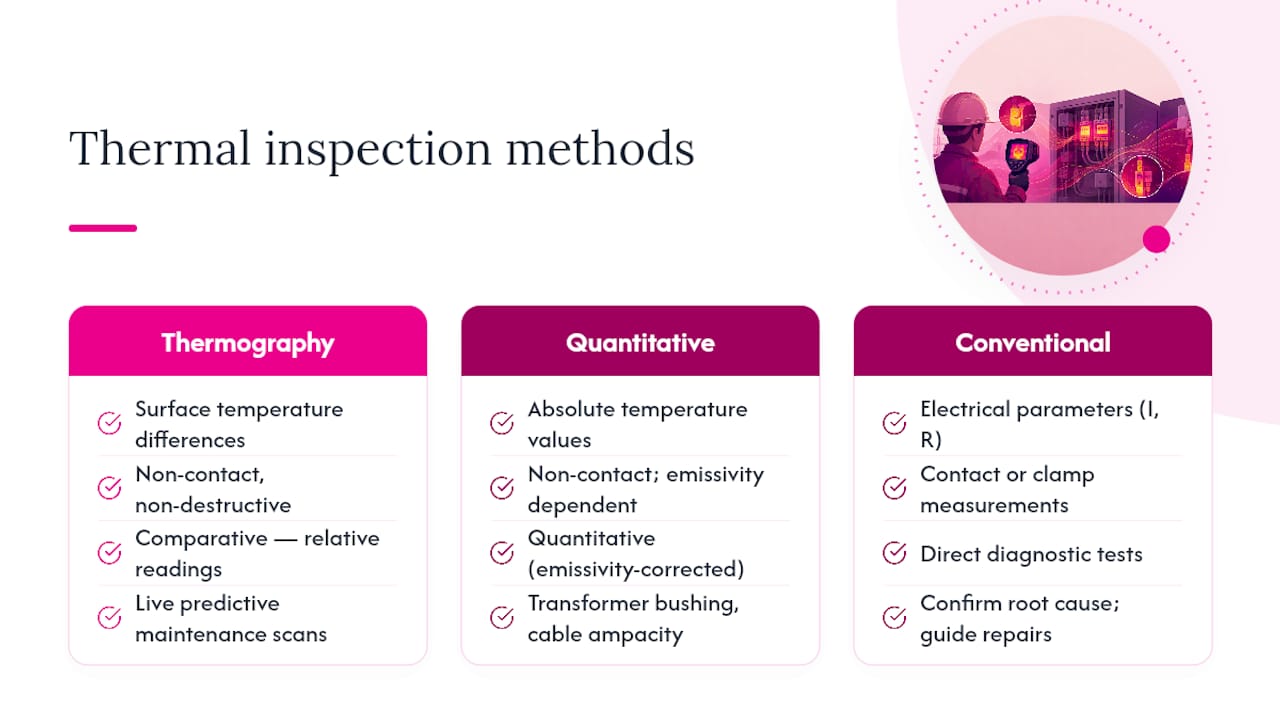
Thermography measures surface temperature differences by detecting infrared radiation emitted by every object above absolute zero. A thermal camera converts that radiation into a false-colour image, where warmer areas appear in reds and yellows and cooler areas in blues and purples, giving a technician an immediate visual map of heat distribution across electrical components.
The key word is surface. Cameras read emitted radiation from the outermost layer of a component, not internal temperatures. That distinction matters for interpretation: a busbar running hot on its surface tells you something is wrong, but the root cause sits underneath, at a connection, inside insulation, or within the conductor itself. Thermal imaging is a non-contact, non-destructive diagnostic method that identifies faults while equipment remains live, which is precisely why it fits so well into predictive maintenance programmes for commercial and industrial facilities.
Thermography is primarily comparative in electrical work. You are looking for temperature differences between similar components operating under identical loads, not absolute temperature readings. This qualitative approach reduces the sensitivity to emissivity errors and makes findings more defensible in reports. Quantitative measurement, where you need an accurate absolute temperature, requires careful emissivity correction and is reserved for specific applications such as transformer bushing assessment or detailed cable ampacity work.
Thermal imaging complements, rather than replaces, conventional electrical testing. It finds anomalies faster during normal operation, but a clamp meter, insulation resistance tester, or contact thermometer is still needed to confirm root cause and guide repairs.
Which electrical components are typically scanned?
A professional electrical thermography inspection covers a broad range of assets. The scope depends on facility size and criticality, but the following components appear in virtually every commercial or industrial survey.
Primary targets:
- Main switchboards and distribution boards, including busbars, incoming feeders, and outgoing circuit breakers
- Bolted and crimped connections at all terminals, cable glands, and lugs
- MCB and MCCB terminals, particularly under high-load circuits
- Fuses and fuse holders, where a blown or degraded fuse creates a distinctive thermal signature
- Transformers, including bushings, cooling fins, and tank surfaces
- Motor control centres (MCCs) and variable speed drives
- Cable trays and conduit runs where overloaded or undersized conductors may be present
- UPS systems and battery banks
- PV array modules, junction boxes, and DC combiner boxes (governed by IEC 62446-3)
Prioritising by criticality: the main incomer, critical production feeders, safety circuits, and any asset whose failure would cause a shutdown or safety incident should always be scanned first. Transformers and UPS systems warrant particular attention because their failure modes develop slowly and are expensive to miss. For strata and commercial portfolios, strata electrical maintenance programmes benefit from consistent asset coverage across multiple boards.
Solar PV as a special case: PV module thermography follows a different protocol. IEC 62446-3 classifies fault types (bypass diode failures, cell cracks, soiling patterns) and specifies minimum irradiance levels and imaging angles. A general electrical thermographer without PV-specific training should not be interpreting module-level faults.
What fault signatures should you look for in a thermogram?
The core answer: look for unexpected temperature differences between like components operating under the same load. Those differentials are your highest-value findings, and they are far more reliable than any single absolute temperature reading.
NETA guidance recommends immediate investigation when temperature differences between similar components exceed roughly 15°C. Below that threshold, findings are still documented and monitored, but the urgency scales with the magnitude of the differential and the criticality of the asset.
Common fault signatures and their likely causes:
- Hot spot at a single terminal or connection: almost always a loose, corroded, or undertorqued connection. The resistance at the joint generates localised heat that does not follow the conductor.
- Elevated temperature along a full conductor run: load-related heating. The conductor may be undersized for the current it is carrying, or the circuit is overloaded.
- Phase imbalance: one phase running noticeably hotter than the other two in a three-phase system. Causes include unbalanced loads, a failing component on one phase, or a connection issue on the cooler phases.
- Uniform heating across a component: often normal under high load, but worth comparing against manufacturer ratings and similar equipment nearby.
- Cold spots: a blown fuse or shunted current path. Not all anomalies are hot; a fuse that has partially failed may show as cooler than its neighbours because current is no longer flowing through it.
Pro Tip: To distinguish load-related heating from a connection fault, follow the thermal signature along the circuit. A hot spot confined to a single terminal or joint points to a connection problem. Heat that tracks the full length of a conductor suggests the conductor itself is the issue, typically overloading or undersizing. Comparing all three phases side by side under balanced load conditions makes this distinction much clearer.
When should you scan, and what load is required?
The core rule: inspect under normal operating conditions and, wherever possible, under high load. Industry guidance commonly cites a minimum of approximately 40% nominal load to reliably reveal resistance-based heating. At lower loads, the temperature differential between a faulty and a healthy connection may be too small to detect reliably, and you risk missing real faults.
Scheduling guidance:
- Coordinate with operations to schedule scans during peak production or peak demand periods
- Avoid scanning immediately after a major load change or transient event, as temperatures need time to stabilise
- For commercial buildings, mid-morning on a weekday typically captures representative load; for industrial sites, align with full production runs
- Plan follow-up verification scans after repairs under the same load conditions used during the original survey
Solar PV timing: PV thermography has stricter constraints under IEC 62446-3. Scans require minimum irradiance levels (typically above 600 W/m²), low wind speed, and a sun angle that avoids reflections. In most Australian locations this means late morning to early afternoon on clear days. Scanning on overcast days or at low irradiance produces unreliable results and cannot be used to classify faults under the standard. For a compliant solar system inspection, confirm the thermographer understands these constraints before booking.
How do you keep live inspections safe?
Opening an energised switchboard panel for a thermal scan carries real arc-flash risk. The direct answer: follow your facility's electrical safety procedures, complete an arc-flash risk assessment before opening any panel, and ensure the thermographer wears appropriate PPE rated for the available fault energy at that point in the system.
The better long-term answer is IR inspection windows. Closed-panel inspections through IR windows reduce arc-flash exposure and allow faster, more repeatable scans that support predictive maintenance programmes aligned with NFPA 70E safety principles. The panel stays closed, the thermographer images through a permanently installed sapphire or calcium fluoride lens, and the scan takes a fraction of the time of an open-panel survey.
Benefits of IR windows:
- Panel remains energised and closed throughout the scan, eliminating the need to open live equipment
- Reduced PPE requirements because arc-flash exposure is contained
- Consistent imaging angle and distance for every scan, which is critical for baseline trending
- Faster inspection cycle, enabling more frequent surveys without significant operational disruption
Pro Tip: When specifying IR windows, position them to give a direct line of sight to the highest-risk components: main busbars, incoming terminals, and high-current connections. Keep the lens clean and undamaged; contamination or scratches affect transmissivity and introduce apparent temperature errors. Note the window's transmissivity factor in the report so future thermographers can apply the same correction and results remain comparable over time.
Why do emissivity and reflective surfaces affect your readings?
Emissivity is the measure of how efficiently a surface emits infrared radiation compared to a perfect blackbody. Most electrical thermography is comparative, which reduces the sensitivity to emissivity errors because you are comparing similar materials under similar conditions. When you need an absolute temperature reading, emissivity correction becomes critical.
Practical issues to watch for:
- Bare, polished metal surfaces (aluminium busbars, copper conductors) have low emissivity and reflect infrared radiation from surrounding objects, making them appear cooler or hotter than they actually are
- Painted or oxidised surfaces have higher, more consistent emissivity and give more reliable readings
- Cable insulation and plastic enclosures typically have high emissivity and are straightforward to measure
- Reflections from adjacent hot components can create false hot spots on reflective surfaces
When a thermographer encounters a reflective surface, the correct approach is to apply a small patch of high-emissivity tape or paint to the surface, measure that patch, and note the correction in the report. Alternatively, visible/IR image overlay, a feature available on professional cameras from FLIR and Fluke, helps confirm which component is actually being measured by aligning the thermal image with the optical image.
When quantitative measurement is required: for transformer bushing temperature assessments, cable ampacity verification, or any situation where an absolute temperature limit applies, the thermographer must apply emissivity correction and document the value used. For routine comparative switchboard surveys, qualitative imaging is sufficient provided the comparison is between similar components under the same load.
What camera specifications should you require from a thermographer?
Insist on a camera with professional thermal resolution, high sensitivity, a suitable distance-to-spot ratio, and optical overlay capability. These are not optional extras for electrical work; they determine whether small terminal faults are detectable at all.
| Specification | Minimum requirement | Why it matters |
|---|---|---|
| Thermal resolution | 320×240 pixels | Resolves small terminals and connection points clearly |
| NETD (sensitivity) | Below 50 mK | Detects small ΔT values between similar components |
| Distance-to-spot (D:S) ratio | Appropriate for working distance | Ensures the measured spot is the component, not surrounding air |
| Temperature range | — | Covers the full range of electrical fault temperatures |
| Optical overlay (visible/IR fusion) | Required | Confirms component identity in reports; essential for clear documentation |
| Calibration status | Current calibration certificate | Ensures measurement accuracy and report defensibility |
Camera specification guidance for electrical work highlights thermal resolution at minimum 320×240, NETD below 50 mK, suitable D:S ratio, and optical overlay for clear component identification. Professional-grade cameras from FLIR (Teledyne FLIR) and Fluke meet these requirements; entry-level consumer cameras typically do not. FLIR's guidance on electrical contractor tools emphasises that visible/IR image fusion improves fault identification and makes reports far clearer for clients and engineers reviewing findings.
Require the thermographer to disclose the camera make, model, serial number, and calibration certificate status in every report. A report without this information cannot be independently verified.
What do you do after finding a hot or cold spot?
Thermal imaging finds the anomaly; electrical measurements confirm the cause. Thermal imaging does not replace electrical testing: it is a faster way to locate anomalies during normal operation, but a clamp meter, resistance check, or voltage drop measurement is needed to diagnose the root cause and guide the repair.
Verification and repair workflow:
- Document the thermal anomaly with both thermogram and visible image before any intervention
- Assess the priority: a ΔT above 15°C on a critical circuit warrants immediate investigation; lower differentials on non-critical assets can be scheduled
- If the asset can be safely isolated, measure current draw, check connection torque against manufacturer specifications, and inspect for corrosion or mechanical damage
- For conductors showing load-related heating, measure current with a clamp meter and compare against the cable's rated ampacity
- Make repairs: re-torque connections, replace corroded lugs, upgrade undersized conductors, or replace failing components as indicated
- Re-scan under the same load conditions used in the original survey to confirm the anomaly has been resolved
Pro Tip: Always capture a post-repair thermogram under the same load conditions as the original scan. This creates a documented baseline for that asset and provides clear evidence that the remediation was successful. Insurers and WHS auditors increasingly expect before-and-after thermograms as part of the corrective action record.
For high-priority findings, an emergency make-safe response may be required before the next scheduled maintenance window.
How often should you inspect, and what thresholds trigger action?
Set inspection frequency by asset criticality and risk. Annual surveys are the baseline for most critical switchboards; high-risk or ageing assets may warrant more frequent scanning.
Recommended inspection frequency by asset class:
| Asset criticality | Recommended frequency | Post-detection escalation |
|---|---|---|
| Critical (main incomer, UPS, production feeders, safety circuits) | Every 6 months | Immediate investigation for ΔT >15°C; repair within 7 days |
| Important (sub-distribution boards, transformers, MCCs) | Annually | Repair within 30 days for ΔT 10–15°C; monitor if below 10°C |
| Standard (general distribution, lighting boards) | Every 1–2 years | Schedule repair promptly; re-scan at next cycle |
Baseline trending: thermography's predictive value rises significantly when you compare current images against baseline images taken under consistent conditions. A single scan is a snapshot; a series of scans at the same load and ambient conditions reveals whether a connection is degrading, stable, or improving after repair. Record the measured load, ambient temperature, camera settings, and imaging position for every scan so future comparisons are valid.
Escalation thresholds: NETA guidance recommends immediate investigation when temperature differences between similar components exceed roughly 15°C. Below that, findings are still documented and tracked. The escalation timeframes above are indicative; always apply engineering judgement based on the specific asset, its age, load profile, and consequence of failure.
Key takeaways
A thermal imaging electrical inspection is only as reliable as the load conditions, camera specifications, and thermographer credentials behind it.
| Point | Details |
|---|---|
| Minimum load requirement | Scan under at least 40% nominal load so resistance-based heating is detectable. |
| ΔT escalation threshold | Investigate immediately when temperature differences between similar components exceed roughly 15°C per NETA guidance. |
| Certified thermographer required | Require AS ISO 18436.7 accreditation and camera calibration details in every report. |
| Baseline trending adds value | Compare each scan against prior images taken at the same load and position to track degradation over time. |
| High Demand Electrical | Provides certified Level 2 electrical services in Sydney including safety inspections, switchboard upgrades, and emergency make-safe response following thermal findings. |
What thermal imaging looks like from the contractor's side
There is a gap between what a thermal report recommends and what actually happens on site, and it is worth being direct about it.
Most thermography reports land on a facility manager's desk with a priority list and a set of thermograms. The findings are real, the urgency ratings are defensible, and the remedial recommendations are technically sound. What the report cannot do is torque a connection, replace a corroded lug, or tell you whether the switchboard is worth repairing or due for a full upgrade. That is where a licensed electrician takes over, and the handover between thermographer and contractor is where findings either get acted on or quietly filed away.
The most common corrective jobs after a thermal survey are straightforward: re-torque bolted connections to manufacturer specifications, replace oxidised or undersized lugs, clean and re-terminate cable glands, and occasionally upgrade a feeder that has been running at the edge of its ampacity for years. None of these are dramatic, but collectively they are what keeps a switchboard out of the failure statistics.
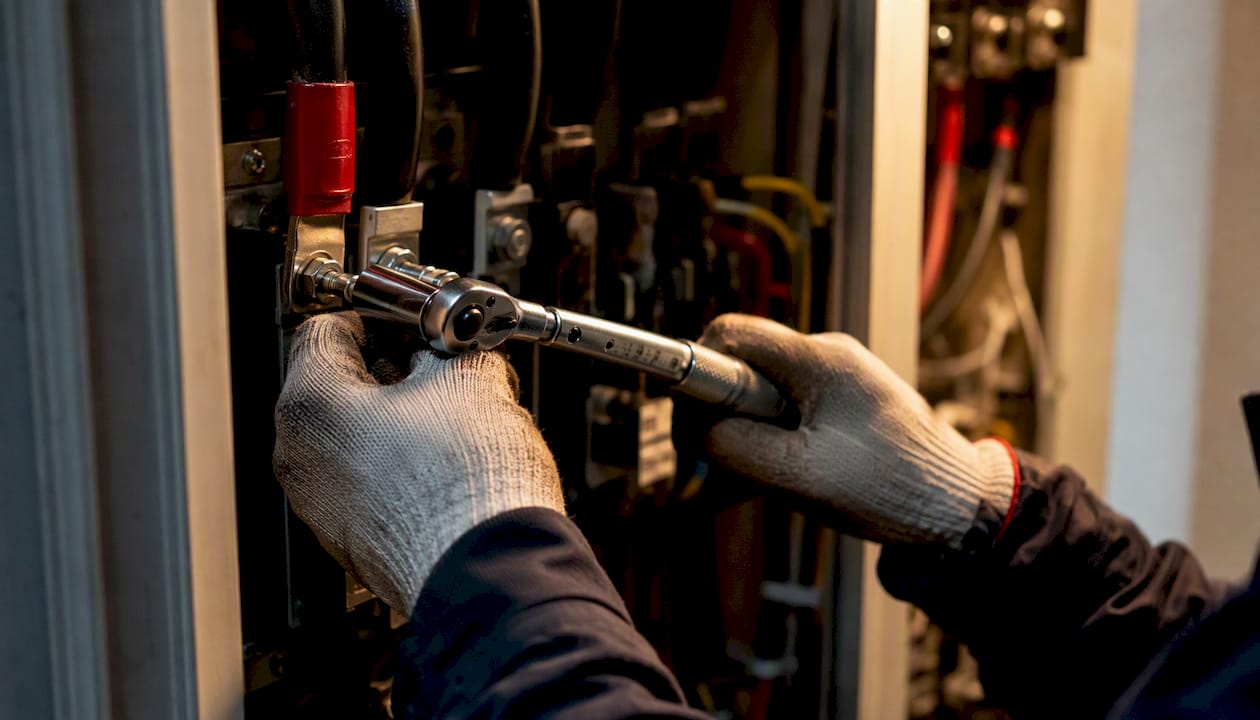
What tends to get underestimated is the value of the re-scan. Facility managers often treat the repair as the endpoint. The re-scan under the same load conditions is what confirms the repair actually worked and resets the baseline for future trending. Without it, you have no documented evidence that the fault was resolved, which matters both for WHS records and for the next insurer conversation.
The other reality: thermal imaging is most useful when it is part of a scheduled programme, not a one-off response to a problem that is already visible. By the time a connection is hot enough to smell or trip a breaker, it has usually been degrading for months. An annual scan on critical assets catches that degradation at the ΔT-15°C stage, not the smoke-and-trip stage.
High Demand Electrical: certified electrical inspections and repairs across Sydney
Sydney facility managers who need more than a report get a complete service from High Demand Electrical. As a certified Level 2 electrical contractor with over 300 five-star reviews, the team handles the full cycle: electrical safety inspections with compliant reporting, immediate follow-up repairs, switchboard upgrades where thermal findings indicate ageing or undersized equipment, and 24/7 emergency response when a critical fault cannot wait.
The difference is that findings do not sit in a report waiting for a second contractor. High Demand Electrical's licensed electricians verify thermal anomalies on site, carry out remedial work to NSW standards, and provide the before-and-after documentation insurers and WHS auditors expect. For urgent findings, the emergency make-safe service is available around the clock. For scheduled programmes, the team coordinates with facility operations to minimise disruption and deliver reports that meet Level 2 electrician compliance requirements.
Call High Demand Electrical on 0402 559 777 to book a site inspection, confirm scope, and get a clear quote for your next thermal survey and any follow-up electrical work.
This article provides general information about thermal imaging electrical inspections. It is not a substitute for professional advice from a licensed electrician or qualified thermographer. Confirm current standards and regulatory requirements with the relevant authority or a qualified professional before proceeding.
Useful standards and resources
- Thermal Imaging for Electrical Inspections | Elec-Mate
- Thermal imaging electrical maintenance application — ISA
- Thermal imaging: electrical systems — Fluke
- Infrared electrical inspection: a complete guide for professionals — IRISS
- Thermal imaging for electrical contractors | FLIR
Recommended
Powering Your Needs with Expertise
If you’re looking for a reliable, experienced, and prompt electrician, look no further than High Demand Electrical. We cater to all your electrical needs, from routine maintenance to emergency repairs and complete system installations. Our skilled team is committed to providing professional service that ensures your electrical systems run smoothly. Whether it's a small task or a large project, give us a call today. Let us meet all your electrical demands with the quality and reliability you deserve.